Source: Disk Defragmentation
Part 1: Create a 128x128 grid. Generate each row by taking the knot hash of
salt-{index}. The bits of the hash represent if a tile in the grid isfree(0) orused(1).
Given your salt as input, how many squares are
used?
Hah! We are going to use the knot hashes again! Good thing I put them in lib.py. We do need a function to take the hex output of knothash and turn it into a bitstring though:
def hex2bits(hex):
    return ''.join(bit for c in hex for bit in '{:04b}'.format(int(c, 16)))
Similar to how we converted bytes into hex in the first place, we’re going to use format strings
to convert them to binary. Take each character c, convert it back to an int(c, 16) (an integer using base 16 as the input), and then format it as a four character wide, zero padded, binary value ({:04b}). Stick those all together with ''.join(...) and we have a bit string.
Combine the two and we can generate the grid:
# Generate a grid of bits based on knothashes of the input
data = []
for row in range(128):
    value = '{}-{}'.format(lib.param('key'), row)
    hash = lib.knothash(value)
    bits = lib.hex2bits(hash)

    lib.log(f'{value} {hash} {bits}')

    data.append(bits)
sum a generator and we have the count:
# Calculate how many 1 bits we have for part 1
used_count = sum(
    1 if bit == '1' else 0
    for row in data
    for bit in row
)
print(f'{used_count} used')
Part 2: A region is a block of adjacent
usedblocks (no diagonals). How many regions are there in your grid?
This is more or the less the same problem as part two of day 12. We can iterate over the grid, flood filling any regions we haven’t seen before to count them:
# Make a map of point to regions
def get_region(point):
    '''Flood fill a region from a given point, yield all points in the same region.'''

    nodes = set()
    q = queue.Queue()
    q.put(point)

    while not q.empty():
        point = q.get()

        if point in nodes:
            continue
        else:
            yield point
            nodes.add(point)

        x, y = point
        for xd, yd in [(-1, 0), (1, 0), (0, -1), (0, 1)]:
            if 0 <= x + xd < 128 and 0 <= y + yd < 128 and data[x + xd][y + yd] == '1':
                q.put((x + xd, y + yd))
And then we can use the algorithm from before and this flood fill to count regions:
point_to_region = {}
region_to_point = {}

for x in range(128):
    for y in range(128):
        point = (x, y)
        region_label = 0

        # Expand points that haven't already been labeled
        if data[x][y] == '1' and point not in point_to_region:
            points = set(get_region(point))
            region = len(region_to_point)

            region_to_point[region] = points

            for point in points:
                point_to_region[point] = region

region_count = len(region_to_point)
print(f'{region_count} regions')
Runs in about a second too:
$ python3 run-all.py day-14

day-14  python3 knot-hash-gridinator.py --key nbysizxe  1.0507738590240479      8216 used; 1139 regions
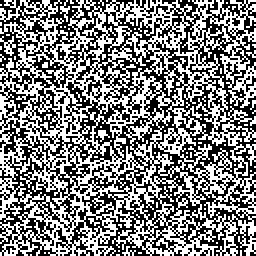
As an aside, I wanted to see what my grid actually looked like. A long while ago I wrote up a function that could be used to generate an image given a generator function:
def generate_image(width, height, generator):
    '''
    Generate an RGB image using a generator function.

    width, height -- the size of the generated image
    generator -- a function that takes (x, y) and returns (r, g, b)
    '''

    # Generate the data as a row-major list of (r, g, b)
    data = [generator(x, y) for y in range(height) for x in range(width)]

    # Pack that into a Pillow image and return it
    img = PIL.Image.new('RGB', (width, height))
    img.putdata(data)
    return img
Using that, we can directly render the region using black pixels for free and white for used:
def generate_pixel(x, y):
    g = 0 if data[x][y] == '1' else 255
    return (g, g, g)

generate_image(128, 128, generate_pixel).save('knot-hash-grid.png')

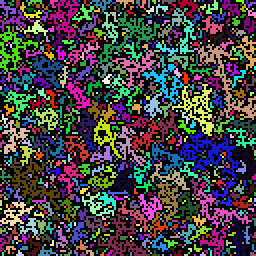
And if we want to color each region (with a random color, chosen once per region):
def generate_region_pixel(x, y, colors = {}):
    if data[x][y] == '0':
        return (0, 0, 0)

    region = point_to_region[x, y]
    if region not in colors:
        colors[region] = (random.randint(0, 255), random.randint(0, 255), random.randint(0, 255))

    return colors[region]

generate_image(128, 128, generate_region_pixel).save('knot-hash-grid-regions.png')

It’s interesting how large some of those regions get… I like generative images. 😄
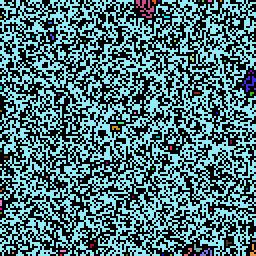
One more last thing, there’s a reason they told us to ignore diagonals. If you change the for xd, yd in line to include diagonals, almost the entire image becomes one big region:
