Source: Digital Plumber
Part 1: A network of nodes is defined by a list of lines formatted as such:
2 <-> 0, 3, 4
> In this case, node `2` is connected to `0`, `3`, and `4` and vice versa.

> How many nodes are in the group that contains the node `0`?


First, load the data into an [[wiki:adjacency map]]():

```python
nodes = set()
neighbors = collections.defaultdict(set)

for line in lib.input():
    source, destinations = line.split('<->')
    source = int(source.strip())
    nodes.add(source)

    for destination in destinations.strip().split(','):
        destination = int(destination.strip())
        nodes.add(destination)

        neighbors[source].add(destination)
        neighbors[destination].add(source)
Then, write a function that can take a node and recursively expand until it finds all nodes in the same group:
def find_group(node):
    '''Yield all nodes that are connected to the given node.'''

    visited = set()
    q = queue.Queue()
    q.put(node)

    while not q.empty():
        node = q.get()

        if node in visited:
            continue
        else:
            visited.add(node)

        yield node

        for neighbor in neighbors[node]:
            q.put(neighbor)
This is enough to tell how big the group containing 0 is:
print('the group containing 0 has {} nodes'.format(len(list(find_group(0)))))
Part 2: How many groups are there?
This is slightly more interesting since we don’t want to count a group twice if we start from two different nodes in the same group. Mostly though, we will iterate through all the nodes and add 1 to our count if the new node is not one we’ve seen before than record all nodes in that same group:
visited = set()
groups = []

for node in nodes:
    if node in visited:
        continue

    group = set(find_group(node))
    groups.append(group)
    visited |= group

print('there are {} groups'.format(len(groups)))
Since we are working with sets, the | operator is a setwise or, it will include nodes in either group. |= will add any nodes in group to visited that aren’t already there. Since we’re only looking for new groups, they will never overlap, but | still works. Plus, it amuses me somewhat to use the text=“pipe operator” page=“https://en.wikipedia.org/wiki/Vertical_bar”.
All together:
$ python3 run-all.py day-12

day-12  python3 gridlock.py input.txt   0.12310385704040527     the group containing 0 has 115 nodes; there are 221 groups
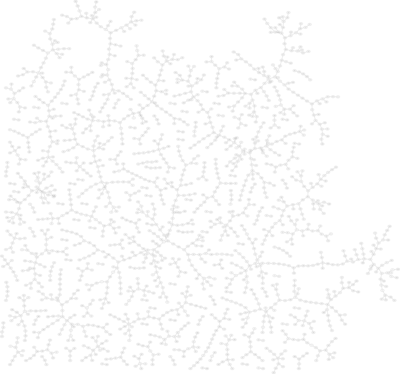
As a fun aside, you could use GraphViz to visualize the graph.
First, generate a graph file with Python:
lib.add_argument('--visualize', default = False, help = 'Filename to write a graphviz file to for visualization')

if lib.param('visualize'):
    with open(lib.param('visualize'), 'w') as fout:
        fout.write('graph {\n')
        for node in nodes:
            for neighbor in neighbors[node]:
                fout.write('  {} -- {}\n'.format(node, neighbor))
        fout.write('}')
Then use one of the layout engines to render it. neato gave me the best results:
$ python3 gridlock.py input.txt --visualize graph.dot
$ neato -Tpng < graph.dot > graph.png
$ open graph.png

Click for full size